


Do you own a Garmin GPS watch or like pretty graphs? If so then read on!
 I have the Garmin ForeRunner 410 GPS watch which I use for all of my running adventures, it is a very fun toy. All the data from Garmin ForeRunner watches automatically get uploaded to the Garmin Connect website which does quite a nice job of displaying the activities - showing a map of the route, and showing the elevation, pace, and heart rate graphs.
 But I'm a web developer so I decided to take it one step further! I've designed a web application which I call Garmin Activity Explorer that lets you analyse public/shared Garmin activities in more detail than you might want.
The main reason why I developed this tool is because I was training for the North Olympic Discovery Marathon, and I wanted to be able to get a good feel of the route since I'd never run the course before. I found a few other people who had run that marathon in previous years and shared their Garmin Connect activities. This allowed me to see the elevation profiles, but I wanted a better sense of how steep the hills were (up and down) and exactly where they were.
The main feature of the Garmin Activity Explorer is that instead of drawing a solid red line on a map to show the route, it divides the line into many tiny segments which get color coded based on one of four properties:
- elevation
- slope
- heart rate
- pace/speed
Here are some screenshots of it in action. The green S marker is the start of the route, and the red F marker is the finish.
Elevation Line Renderer
The first screenshot shows the Times Colonist (TC) 10K route that goes around downtown Victoria. In this example the route is color coded based on the elevation above sea level. Blue and green represent low lying areas, and orange red represent higher elevations (although this route is pretty flat).

Pace/Speed Line Renderer
Similarly, here is the same route but this time it is color coded based on running speed or pace. Red represents slower running, and blue represents faster speeds. By default the line is coloured using the pace at each point, but you can change the segment distance to something like 1000 m to see your kilometer splits. In this example I actually used 2000 m (divided the 10 km race into 5 segments).
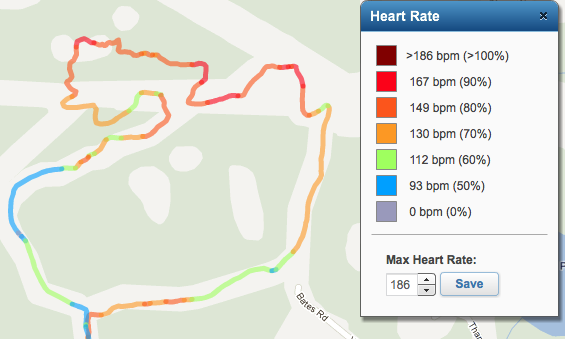
Heart Rate Line Renderer
A route can also be color coded based on the user's heart rate, but in the example above it makes for a very boring screenshot because the heart rate was between 90-100% the whole race, so the route ended up just being a solid red line! So instead here is a screenshot of a route running and down up a nearby mountain (Stewart Mtn). The line is coloured based the user's heart rate.
Slope Line Renderer
The fourth line renderer option is the slope renderer. It divides the route into small segments (defaults to 100 m) and calculates the slope (how much elevation is gained over the 100 m) for each segment. The line is coloured based on how steep the slope is - green for downhill, red for uphill. I find this to be a very useful choice because it gives you a good sense of how steep the hills are.

The above screenshot also shows red markers at the 5 steepest uphill slopes, and green markers at the 5 steepest downhill slopes. You can click on the markers to get more details.
Here are a few other features:
 | Kilometer markers - markers at each kilometer and halfway |
 | Minimum/Maximum value markers - at the extreme values for the current line |
 | Charts - elevation/pace/heart rate line charts (like Garmin Connect), heart rate pie chart |
 | Data - data table of the raw data points, lap data (splits), and activity details. |
* The Data window details tab shows your final 100m time! This is not necessarily very accurate, it finds the closest data point to being 100m from the finish line, and estimates what your actual 100m time would be. So if you didn't stop your watch right at the finish it might be off by a bit. You can also double click on any data point or lap and it will show you that location on the map. For the laps, it shows the start of the lap.
Here is a screenshot of the charts. Each item in the legend on the right hand side can be unchecked to not display a certain line.


Getting Started
When the application loads, you will be presented with a window asking you to load an activity. There are 3 tabs on this window that let you import an activity in different ways:
- Directly from the Garmin Connect website - all you need is to enter the 8-10 digit id of the public/shared activity (copy and paste from your browser's address bar). These ids are saved for you when you next come back, so enter a title for the activity to help remember.
- From a specific user - if you know the Garmin Connect username, then enter it and click Load. This will load the user's 10 most recent public activities.
- From a local file on your computer - you can export any Garmin activities as a TCX file and save to your computer. These files can be loaded into the application from the 3rd tab.

After you've chosen the activity then choose which line renderer you want to use (this can be changed at any time later) and click the yellow Download button.
When a route has been loaded and is displayed on the map, you may click at any point along the line to get the details - what was the distance from the start, the elevation, pace, etc. It is linked with the Charts view, so you can click on the chart and see where it is in the map, or click on the map to see where it is in the chart.
Another easily missed feature is the
Kilometer markers. If you click on any of the markers you will get lots of information about that location: what was the running time, elevation, pace, etc. The halfway point is marked with a blue marker which lets you easily determine your halfway split!
Comparing Routes
I've recently added a new feature for comparing two or more routes. Once you've loaded one activity, you can click the Load New Activity button and the top and choose a different activity. Before you click the download button - check the Compare against current route checkbox. This will draw both routes on the map. The first route can be coloured and displayed in the charts view. The second (third, fourth, etc) route is coloured in a different solid color. Why would you use this feature? It's great at comparing the same course from two different watches, or for comparing two different but similar courses (e.g. when a race changes the route slightly).
For example, here is this years Gunnar Shaw Race. If you then go and Load New Activity and enter in this activity id 58258801 and check the compare checkbox, you'll see how the route changed from last year (no puddle!) to this year.
A few more things to note - in the top right corner of the map are 5 map type choices - the default Google Map, Satellite, and Hybrid. And then there's two other neat ones - Terrain and OSM (Open Street Map). The OSM map type is very good for showing trails.
When you load a public Garmin Activity your browser address bar URL will change to include the activity id, line renderer, and km markers like this:
.../GarminMaps.html#gid=82783960&km=on&rid=elevation
This means that you can bookmark and share any public activity.
Anyway, this is much too long for anyone to have actually read. But I welcome feedback and suggestions. Please feel free to tell your friends who use a Garmin GPS watch (or any other one that supports the TCX file standard) about this site if you thinks it's useful.
Here is the link to the application:
Garmin Activity Explorer